
17.4.3.1.1. Setting Single Ink Limits
To examine and set the single ink limits for the channels click on the Graph (6) button. It is this graph we will use to determine the maximum ink value for each ink channel.
You should now see a graph that represents the measurements just made for all the channels similar to the one below.
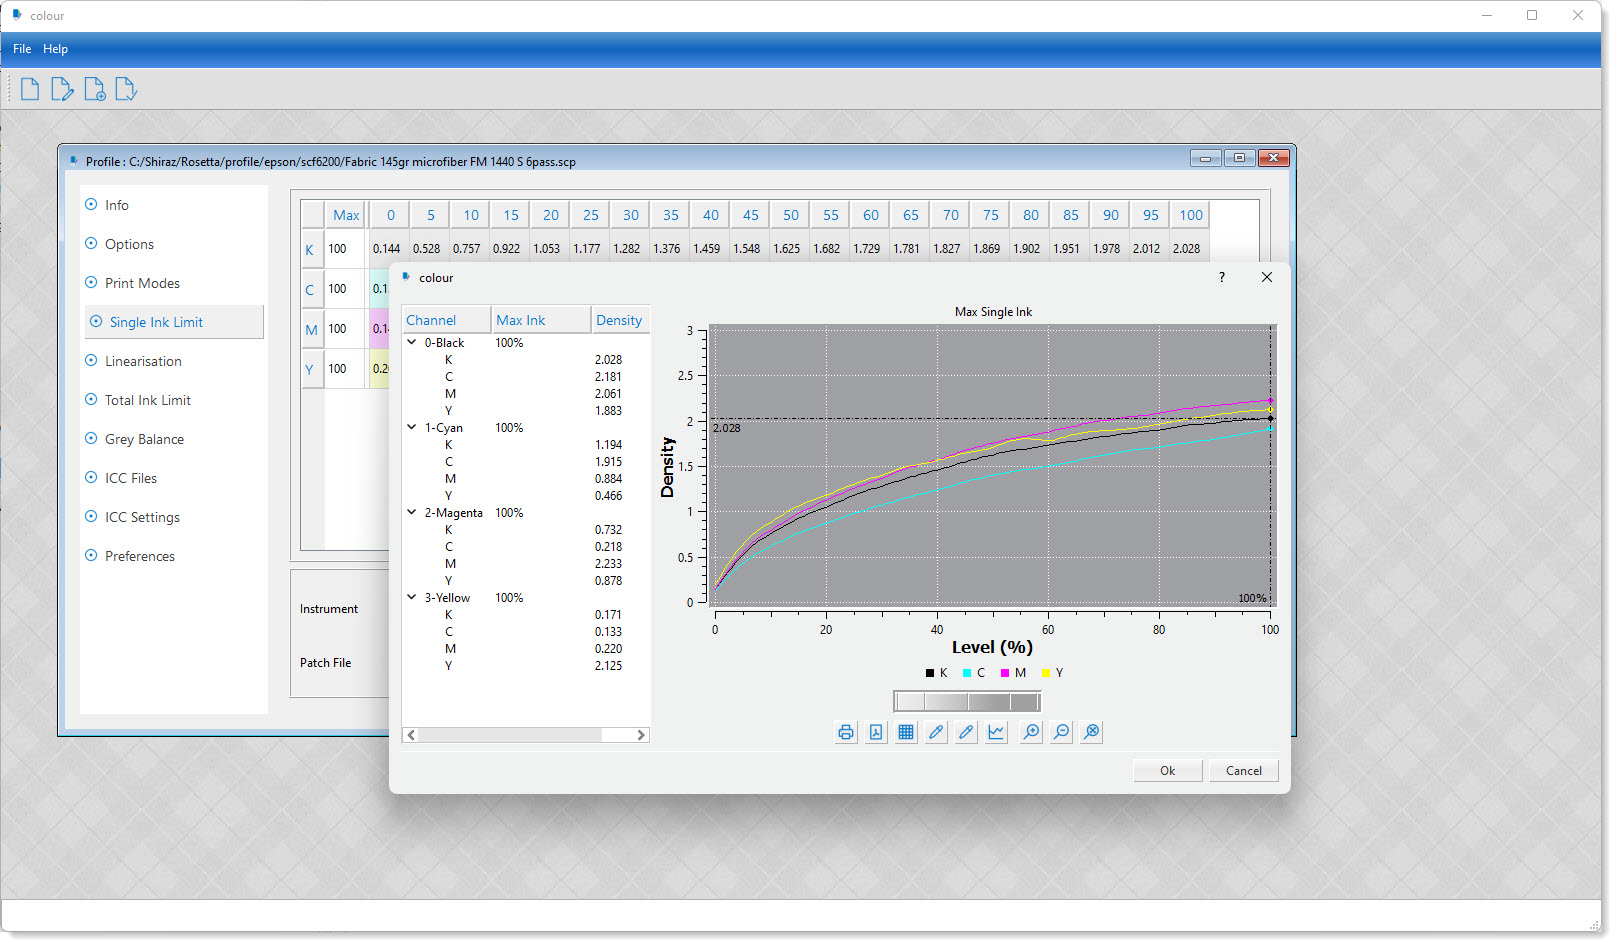
Please note that your graph might look different to the one shown above depending on the printer / media / ink / resolution / process etc.
The graph X-axis ranges from 0 to 100 that represents dot percentage put down on the paper and the Y-axis shows the corresponding density value for these levels.
In majority of cases you should see an increasing growth in the density as the level values increases. The keys to setting the single ink limit are based on two factors.
-
Density value decreases or flattens out as the level value increases.
-
The desired density value is reached before the 100% level.
In this example although the density value has a steady growth to the end but because of the high density values that have been achieved we could set the ink levels for the channels lower than the maximum values at 100% level. This is demonstrated in the figure below.
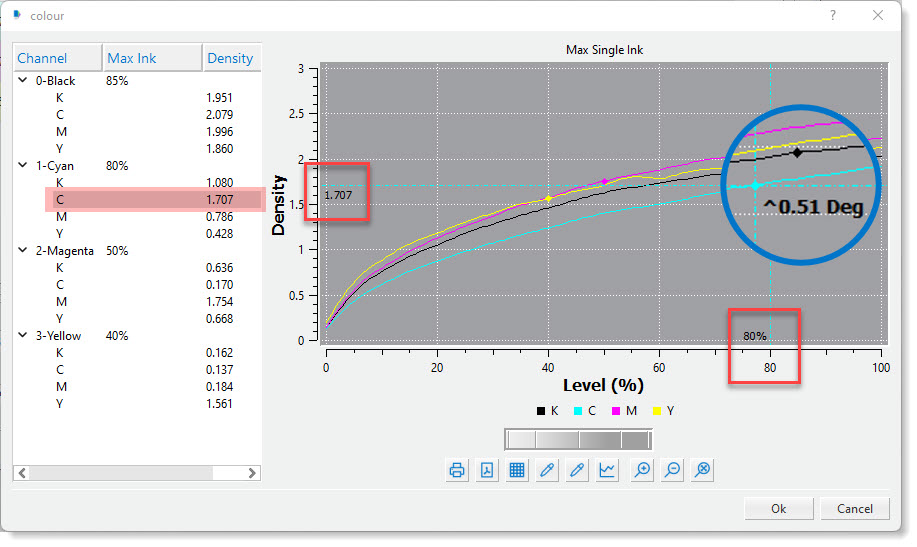
As can be observed from above the single ink limits tree, on the left hand side, the channels have been set to 85%, 80%, 50%, 40% for the Black, Cyan, Magenta, Yellow respectively.
Looking at the Cyan channel it can be seen that the a density of 1.707 has been achieved at 80% already that for most cases is considered as sufficient. Any increase in the density might not actually achieve a better colour gamut or indeed be detrimental. For some inks there are a high content of magenta in the cyan and yellow in magenta, so for each primary colour you can actually see the density for the other channels too. In the example here you will notice that the density for Cyan at 80% is 1.707 and 0.786 and 0.428 for Magenta and Yellow respectively.
In the highlighted (zoomed up) area you can also see that at the Cyan ink limit point the graph gradient is 0.51 degree. This value can assist you in deciding the limits. As the value starts to decrease and gets close to zero or becomes negative, it actually imply the flattening out of the curve.
Bear in mind that with the black channel it is also important that the solid black has no ‘holes’ or white patches. You can check for this by visually inspecting the printed patches by a magnifying glass.
To graphically set the ink limits for the channels, first click on the colour icon for the channel and then use the thumb wheel widget to move the cross hair across the graph. The various icons under the thumb wheel can be used to configure the various parameters of the graph as well as print or save the it. Click the OK button to save and exit the window.