
17.4.3.4.4. Print
For users who require the ability to add G7 Curves to the Shiraz Colour Workflow, we provide the capability to print a P2P chart that will have all the print mode, ink limiting and linearization applied to it when printed. You can then use your 3rd party application such the IDEALLIANCE Curve application to measure and create the G7 curve. You should then export the G7 curve as Adobe Curve (ACV) file and import and set it as described in the previous sections.
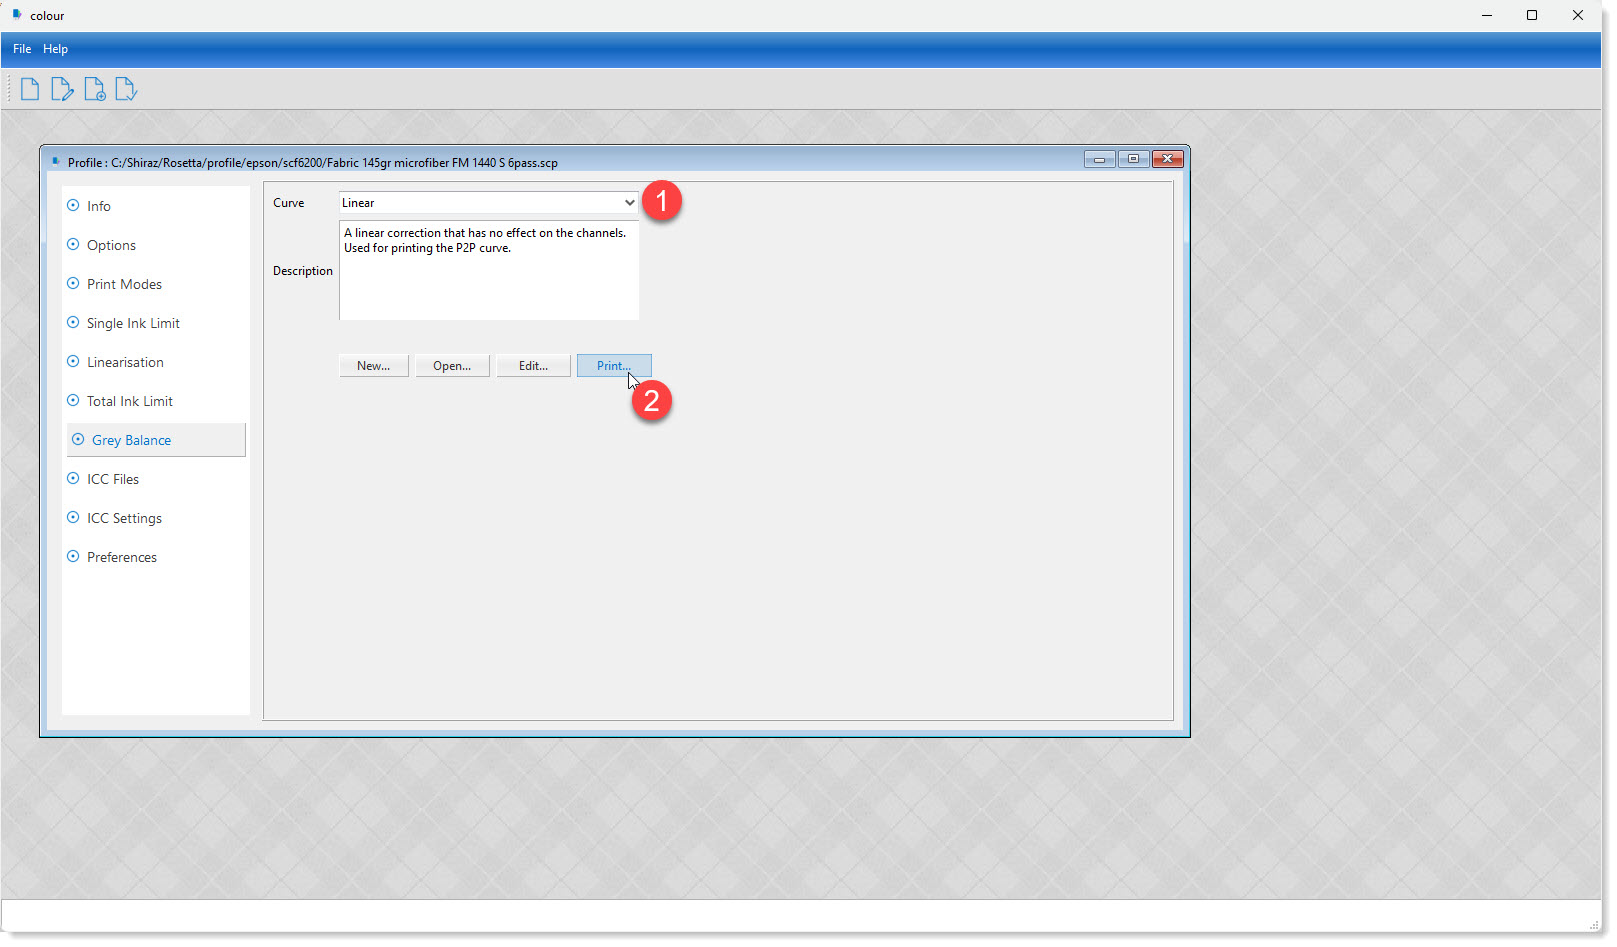
To print the P2P chart you should first select the Linear curve from the drop down list and then click on the Print button. the system will now submit a job to the printer queue for processing and printing. Once the print is fully dried and ready for measurement you should use your particular G7 Curve application to create the grey balance curve.
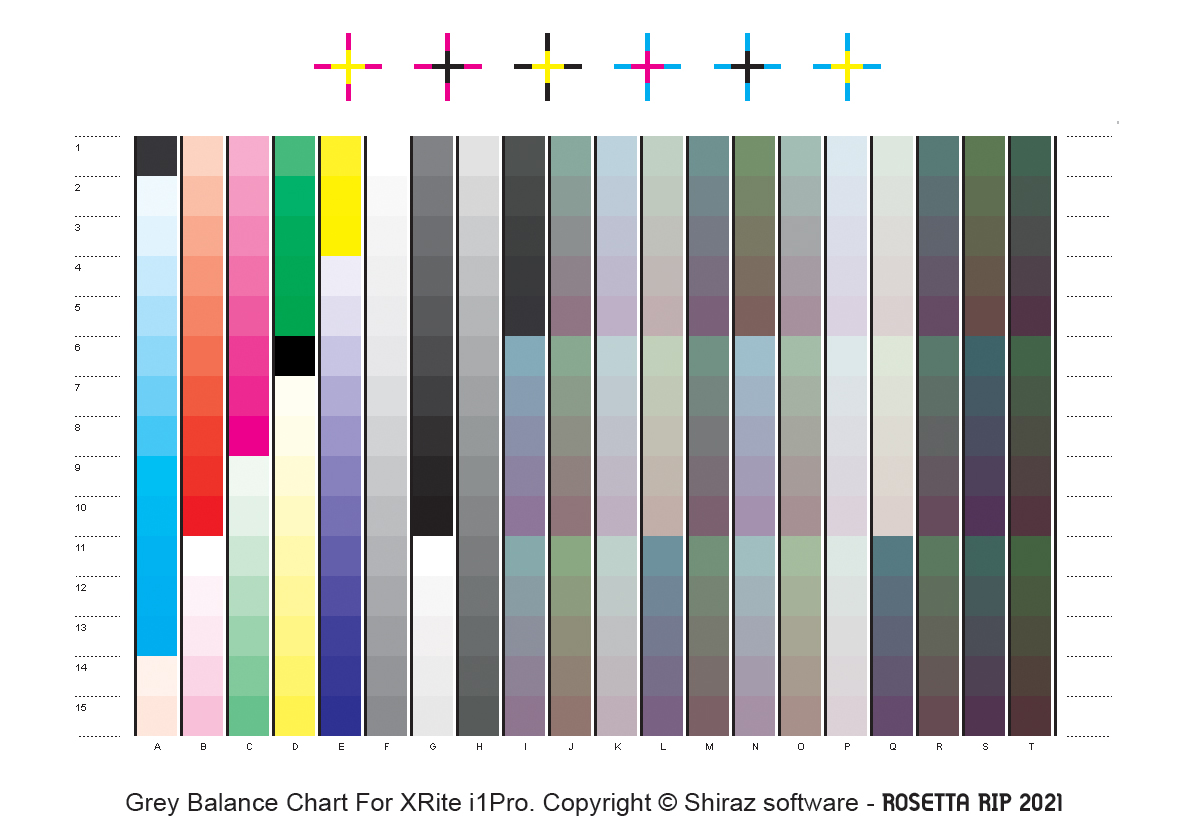
If you prefer to use and print your own grey balance chart then rename the chart file to greybalance.tif and then copy it to the \Shiraz\Rosetta\profile\patch folder, overwriting the existing file there. The system will now print your grey balance file when instructed.